
Professional Certificate in Functional Techniques for Enhanced Data Visualization
Master functional techniques to create impactful data visualizations, driving clearer insights and informed decision-making for enhanced business outcomes.
Professional Certificate in Functional Techniques for Enhanced Data Visualization
Programme Summary
This intensive programme equips data analysts, business intelligence specialists, and emerging leaders with advanced methodologies for transforming complex datasets into compelling visual narratives. Participants engage with rigorous frameworks that bridge the gap between raw statistical analysis and strategic decision-making, ensuring that visual outputs align precisely with organisational objectives. The curriculum targets professionals who seek to elevate their analytical communication beyond standard reporting, focusing on the psychological principles of perception and cognitive load management. Learners explore the integration of interactive dashboards and static reports within modern enterprise environments, mastering the art of clarity in high-stakes presentations.
Students acquire proficiency in industry-standard tools such as Tableau and Power BI, while simultaneously developing a critical eye for design aesthetics and functional utility. The course emphasises the selection of appropriate chart types to prevent misinterpretation, ensuring that every visual element serves a distinct analytical purpose. Participants learn to construct dynamic storytelling arcs that guide stakeholders through intricate data landscapes, fostering deeper engagement and faster comprehension. Training includes practical workshops on colour theory, spatial arrangement, and annotation techniques, all designed to enhance the immediate readability and impact of visualisations.
Graduates emerge capable of driving data-led strategies that significantly influence executive decision-making processes across various sectors. This certification distinguishes holders in the competitive job market by demonstrating a unique blend of technical expertise and communicative finesse. Employers value these professionals for their ability to translate abstract metrics into actionable insights, thereby accelerating organisational agility and strategic alignment. Alumni frequently assume senior roles in analytics leadership, consulting, or product management
Learning Outcomes
This rigorous professional certificate equips senior analysts, data scientists, and business leaders with the advanced functional techniques necessary to transform complex datasets into compelling visual narratives. In a landscape saturated with information, the ability to communicate insights clearly is paramount. This programme moves beyond basic charting to explore the cognitive principles underlying effective visual perception, ensuring that every graphic serves a distinct strategic purpose.
Participants engage with a comprehensive curriculum that covers advanced colour theory, spatial arrangement, and the integration of interactive elements within static reports. The syllabus emphasizes the use of industry-standard tools such as Tableau and Power BI, while also addressing the nuances of Python libraries like Matplotlib and Seaborn. Students learn to strip away visual clutter, employing minimalist design principles that highlight critical trends without overwhelming the viewer. Case studies drawn from finance, healthcare, and retail sectors provide practical context, allowing learners to refine their ability to tailor visualisations for diverse stakeholder audiences.
Graduates emerge with the confidence to lead data storytelling initiatives within their organisations. They apply these skills to drive decision-making by presenting complex analytical findings in an accessible, persuasive format. This capability is highly sought after in roles such as Head of Data Analytics, Visualisation Specialist, and Strategic Insights Manager. Employers value professionals who can bridge the gap between technical data processing and executive strategy. By mastering these functional techniques, alumni position themselves as indispensable assets capable of translating raw data into actionable business intelligence. The programme fosters a community of practice, connecting participants with peers and mentors who share
Programme Features
Industry-Aligned Curriculum
Developed with industry leaders for job-ready skills
Globally Recognised Certificate
Recognised by employers across 180+ countries
Flexible Online Learning
Study at your own pace with lifetime access
Instant Access
Start learning immediately, no application process
Constantly Updated Content
Latest industry trends and best practices
Career Advancement
87% report measurable career progression within 6 months
Course Modules
- Data Preparation and Cleaning: Techniques for structuring raw data into visualization-ready formats.: Visual Perception Principles: Understanding how human cognition processes visual information.
- Chart Selection Strategies: Guidelines for choosing the most effective chart types for specific datasets.: Interactive Dashboard Design: Methods for building dynamic, user-driven visualization interfaces.
- Color Theory and Accessibility: Best practices for using color to enhance clarity and ensure inclusivity.: Storytelling with Data: Frameworks for constructing compelling narratives through visual analytics.
What's Included in This Programme
Here is what you get when you enrol with LSBR London
Programme Facts
Audience: Data analysts seeking advanced visual communication skills.
Prerequisites: Proficiency in Python and foundational statistical analysis.
Outcomes: Master functional techniques for compelling data storytelling.
Ready to advance your career?
Join thousands of professionals who have transformed their careers with LSBR London. Enrol today and start learning immediately.
Why Study This Programme
This programme equips practitioners with the analytical rigour necessary to transform complex datasets into compelling visual narratives. In an era where data literacy is paramount, mastering functional techniques distinguishes competent analysts from strategic leaders. The curriculum is designed to bridge the gap between raw statistical output and actionable business intelligence, ensuring that visualisations drive decision-making rather than merely presenting information.
Enhanced Strategic Communication: Participants learn to align visual outputs with executive priorities, enabling them to articulate insights clearly to non-technical stakeholders. This skill directly influences project approval rates and resource allocation within senior management teams.
Advanced Technical Proficiency: The course covers industry-standard tools and libraries, such as D3.js and Tableau, fostering a versatile skill set. Graduates gain the ability to build interactive, dynamic dashboards that respond to user queries in real-time, significantly improving operational efficiency.
Critical Data Interpretation: Students develop a nuanced understanding of cognitive biases in visual perception. This knowledge allows them to design charts that minimise misinterpretation, thereby reducing the risk of costly strategic errors derived from flawed data presentation.
Competitive Career Advantage: Holding this certificate signals a commitment to continuous professional development. It positions candidates for senior roles in data consultancy and business analytics, where the ability to synthesise information is highly valued by global organisations seeking evidence-based leadership.
"This programme gave me the confidence and credentials to secure a senior role. Highly recommend LSBR London."
— Sarah M., United Kingdom
Course Brochure
Download our comprehensive course brochure with all details
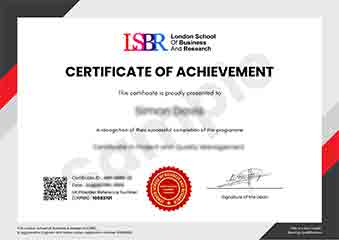
Sample Certificate
Preview the certificate you'll receive upon successful completion of this program.
Get Course Info
Receive the full course guide, pricing details, and enrolment instructions directly in your inbox.
Check your inbox!
Course details have been sent to your email.
Get Your Employer to Sponsor This Programme
Many employers offer professional development budgets. We make it easy for your company to invest in your growth with corporate invoicing and bulk enrolment options.
Email Template for Your Manager
Dear [Manager's Name],
I would like to request sponsorship for the Professional Certificate in Functional Techniques for Enhanced Data Visualization programme offered by LSBR London - Executive Education.
The programme costs $149 (one-time) and can be completed in 3-4 weeks alongside my regular duties.
Key benefits to our team:
- Immediately applicable skills
- Globally recognised certificate
- Corporate invoice available
Best regards,
[Your Name]
What Our Students Say
Hear from our students about their experience with the Professional Certificate in Functional Techniques for Enhanced Data Visualization at LSBR London - Executive Education.
Charlotte Williams
United Kingdom"The course material provided a deep dive into functional programming concepts that immediately improved my ability to create dynamic and efficient data visualizations. I now feel confident in applying these techniques to build interactive dashboards that are both performant and maintainable."
Siti Abdullah
Malaysia"Mastering functional techniques transformed my ability to create dynamic, interactive dashboards that stakeholders actually engage with. This practical skill set directly accelerated my promotion to a senior analytics role by enabling me to deliver clearer, more impactful data stories."
Tyler Johnson
United States"The logical progression of modules made complex visualization concepts accessible and easy to integrate into my existing workflow. I now feel confident applying these functional techniques to create more impactful, data-driven narratives for stakeholders."
Your Certification Journey
Four simple steps from enrolment to your globally recognised certificate
Enrol Online
Complete your enrolment in under 2 minutes with secure checkout
Start Learning
Get instant access to all course materials and start at your own pace
Complete Modules
Work through the curriculum with expert support available throughout
Get Certified
Receive your LSBR London certificate recognised across 180+ countries
LSBR London by the Numbers
Join a global community of professionals advancing their careers
Students Enrolled
Countries Represented
Average Rating
Career Progression