
Global Certificate in Creating Interactive Graphs for Presentations
Master interactive graph creation to enhance presentation impact, engage audiences effectively, and communicate complex data with clarity and visual appeal.
Global Certificate in Creating Interactive Graphs for Presentations
Programme Summary
The Global Certificate in Creating Interactive Graphs for Presentations equips professionals with advanced techniques for designing dynamic data visualisations that drive strategic decision-making. This rigorous curriculum targets business analysts, marketing directors, and executive communicators who require sophisticated tools to transform complex datasets into compelling narratives. Participants engage with industry-standard software platforms, mastering the integration of real-time data feeds and user-driven interactivity within corporate reporting frameworks. The programme addresses the critical need for clarity in high-stakes environments where static charts fail to convey nuanced trends or predictive insights effectively.
Learners acquire proficiency in configuring interactive elements such as hover states, drill-down capabilities, and multi-variable filtering systems within professional presentation software. The course emphasises colour theory, spatial hierarchy, and cognitive load management to ensure visualisations remain accessible and impactful for diverse stakeholders. Students practice converting raw financial and operational metrics into intuitive dashboards that facilitate rapid comprehension and actionable intelligence. Instruction covers the technical implementation of embedded scripts and the ethical considerations surrounding data representation to prevent misinterpretation.
Completion of this certification significantly enhances a candidate’s ability to influence board-level discussions through superior visual storytelling. Graduates demonstrate a distinct competitive advantage by delivering presentations that engage audiences and accelerate consensus-building processes. Employers value this specialised expertise for roles requiring clear communication of complex analytical findings to non-technical leadership teams. The credential signals a mastery of modern data literacy standards, positioning holders for senior advisory or strategic communications roles within global organisations.
Learning Outcomes
In an era defined by data saturation, the ability to transform complex datasets into compelling visual narratives is a critical differentiator for modern professionals. The Global Certificate in Creating Interactive Graphs for Presentations equips participants with the sophisticated technical and design skills necessary to elevate their communication impact. This programme moves beyond static charting, focusing instead on dynamic, user-driven visualisations that foster deeper audience engagement and facilitate rapid decision-making.
Curriculum content spans essential domains including data sanitisation, interactive dashboard architecture using industry-standard platforms such as Tableau and Power BI, and the principles of cognitive load theory in design. Participants master the art of balancing aesthetic clarity with analytical rigour, ensuring that every element serves a strategic purpose. Through rigorous case studies and live project work, learners develop the capacity to craft stories that resonate with both technical experts and executive stakeholders.
Graduates emerge capable of integrating these advanced visualisation techniques directly into high-stakes presentations, boardroom pitches, and public-facing reports. By replacing dense spreadsheets with intuitive, interactive interfaces, they enable audiences to explore data at their own pace, thereby enhancing comprehension and retention. This shift from passive consumption to active exploration significantly amplifies the persuasive power of any presentation.
Career prospects for certificate holders are extensive and lucrative. Organisations across finance, consulting, technology, and public policy actively seek professionals who can bridge the gap between data science and strategic communication. Roles such as Data Storyteller, Business Intelligence Analyst, and Strategic Communications Specialist offer robust pathways for advancement
Programme Features
Industry-Aligned Curriculum
Developed with industry leaders for job-ready skills
Globally Recognised Certificate
Recognised by employers across 180+ countries
Flexible Online Learning
Study at your own pace with lifetime access
Instant Access
Start learning immediately, no application process
Constantly Updated Content
Latest industry trends and best practices
Career Advancement
87% report measurable career progression within 6 months
Course Modules
- Data Visualization Fundamentals: Introduces core principles of visual storytelling and chart selection for clarity.: Interactive Design Principles: Explores user experience strategies to make graphs engaging and intuitive.
- Tool Mastery and Setup: Covers essential software configuration and interface navigation for graph creation.: Building Dynamic Visuals: Demonstrates step-by-step techniques for creating animated and responsive charts.
- Integrating Data Sources: Teaches methods for connecting live data feeds to ensure real-time graph updates.: Presentation Deployment: Focuses on embedding interactive graphs into slides and optimizing for audience viewing.
What's Included in This Programme
Here is what you get when you enrol with LSBR London
Programme Facts
Audience: Professionals seeking advanced data visualisation skills.
Prerequisites: Basic proficiency in standard presentation software.
Outcomes: Master interactive graph creation for impactful presentations.
Ready to advance your career?
Join thousands of professionals who have transformed their careers with LSBR London. Enrol today and start learning immediately.
Why Study This Programme
Acquiring the Global Certificate in Creating Interactive Graphs for Presentations represents a strategic investment in one should prioritise in today’s data-driven marketplace. This qualification equips professionals with the technical proficiency to transform static datasets into dynamic, engaging visual narratives.
Enhanced Stakeholder Engagement: Interactive elements allow audiences to explore data at their own pace, fostering deeper comprehension and retention. Professionals who master this technique significantly improve decision-making processes by enabling stakeholders to manipulate variables and observe immediate outcomes, thereby building trust and clarity in complex reporting environments.
Competitive Differentiation: As visual literacy becomes a critical soft skill, candidates possessing this certification stand out in crowded job markets. Employers increasingly seek individuals who can bridge the gap between technical data analysis and compelling storytelling. This certificate signals a unique capability to communicate insights effectively, distinguishing applicants from peers who rely solely on traditional, static charts.
Mastery of Advanced Tools: The curriculum provides hands-on experience with industry-leading software such as Tableau, Power BI, and Python libraries. This practical training ensures graduates can immediately apply their skills in real-world scenarios, reducing the onboarding period for new roles and increasing their immediate value to organisations seeking to modernise their data presentation strategies.
Improved Analytical Rigour: Designing interactive graphs requires a thorough understanding of data structure and user experience principles. This process refines one’s analytical thinking, ensuring that visualisations are not only aesthetically pleasing but also statistically sound and logically coherent. Such rigour enhances
"This programme gave me the confidence and credentials to secure a senior role. Highly recommend LSBR London."
— Sarah M., United Kingdom
Course Brochure
Download our comprehensive course brochure with all details
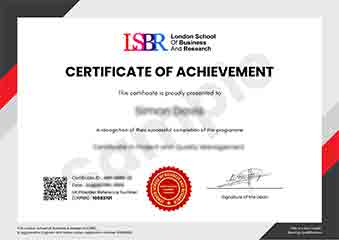
Sample Certificate
Preview the certificate you'll receive upon successful completion of this program.
Get Course Info
Receive the full course guide, pricing details, and enrolment instructions directly in your inbox.
Check your inbox!
Course details have been sent to your email.
Get Your Employer to Sponsor This Programme
Many employers offer professional development budgets. We make it easy for your company to invest in your growth with corporate invoicing and bulk enrolment options.
Email Template for Your Manager
Dear [Manager's Name],
I would like to request sponsorship for the Global Certificate in Creating Interactive Graphs for Presentations programme offered by LSBR London - Executive Education.
The programme costs $99 (one-time) and can be completed in 3-4 weeks alongside my regular duties.
Key benefits to our team:
- Immediately applicable skills
- Globally recognised certificate
- Corporate invoice available
Best regards,
[Your Name]
What Our Students Say
Hear from our students about their experience with the Global Certificate in Creating Interactive Graphs for Presentations at LSBR London - Executive Education.
Oliver Davies
United Kingdom"The course material was incredibly well-structured, allowing me to quickly master the technical nuances of building interactive graphs. I now feel confident creating dynamic visualizations that significantly enhance the impact of my professional presentations."
Ashley Rodriguez
United States"Mastering interactive graph creation has transformed how I present complex data, making my reports significantly more engaging for stakeholders. This practical skill set directly boosted my confidence in client meetings and accelerated my promotion to a senior analyst role."
Sophie Brown
United Kingdom"The logical progression of modules made mastering complex interactive graph concepts feel intuitive and manageable. This structured approach directly enhanced my ability to craft compelling visual narratives for professional presentations."
Your Certification Journey
Four simple steps from enrolment to your globally recognised certificate
Enrol Online
Complete your enrolment in under 2 minutes with secure checkout
Start Learning
Get instant access to all course materials and start at your own pace
Complete Modules
Work through the curriculum with expert support available throughout
Get Certified
Receive your LSBR London certificate recognised across 180+ countries
LSBR London by the Numbers
Join a global community of professionals advancing their careers
Students Enrolled
Countries Represented
Average Rating
Career Progression