
Postgraduate Certificate in Mastering Function Graphs for Data Analysis
Master function graphs to visualize data trends, enhance analytical precision, and drive informed, data-driven decision-making in professional settings.
Postgraduate Certificate in Mastering Function Graphs for Data Analysis
Programme Summary
The Postgraduate Certificate in Mastering Function Graphs for Data Analysis targets quantitative analysts, data scientists, and business intelligence professionals seeking to enhance their visual interpretation capabilities. This rigorous curriculum examines the theoretical underpinnings of continuous and discrete function plotting within complex datasets. Participants engage with advanced software tools to transform abstract mathematical relationships into actionable visual insights. The programme serves as a critical bridge between pure mathematical theory and practical data storytelling in corporate environments. Candidates must possess a foundational understanding of calculus and statistical distributions to fully engage with the requirements.
Learners acquire proficiency in identifying asymptotic behaviours, inflection points, and domain restrictions through dynamic graphing interfaces. The syllabus emphasises the manipulation of parameters to observe real-time changes in function shapes and trajectory predictions. Students master the integration of multiple function layers to reveal hidden correlations within multivariate data sets. Critical evaluation techniques enable participants to detect anomalies and outliers that standard tabular analysis often overlooks. This technical mastery ensures accurate representation of non-linear trends essential for predictive modelling and risk assessment strategies.
Graduates emerge as pivotal assets in sectors requiring high-precision data visualisation, including financial forecasting and operational research. Employers value the ability to communicate complex analytical findings through clear, mathematically sound graphical representations. This certification distinguishes professionals in competitive job markets by demonstrating advanced competency in visual data logic. Career progression opportunities expand into senior analytical roles where strategic decision-making relies on accurate trend identification. The credential validates a candidate’s capacity to drive evidence-based initiatives
Learning Outcomes
This rigorous Postgraduate Certificate equips professionals with the analytical rigour necessary to transform complex datasets into compelling visual narratives. In an era defined by data saturation, the ability to interpret and communicate trends through precise function graphs is no longer optional; it is a critical competency for strategic decision-making. This programme bridges the gap between theoretical mathematics and practical business intelligence, offering a structured pathway for those seeking to elevate their analytical capabilities.
Participants engage with a comprehensive curriculum that moves beyond basic plotting techniques. Core modules explore linear and non-linear regression analysis, logarithmic scaling, and the identification of asymptotic behaviours within large-scale datasets. Students learn to select the most appropriate graphical representations for specific analytical challenges, ensuring that visual outputs accurately reflect underlying mathematical relationships without misleading stakeholders. Emphasis is placed on software proficiency, with hands-on sessions utilising industry-standard tools such as Python’s Matplotlib and R’s ggplot2, alongside advanced Excel functionalities.
Upon completion, graduates are adept at decoding intricate patterns in financial markets, operational logistics, and consumer behaviour. They apply these skills to forecast trends, identify anomalies, and present data-driven insights to executive boards with clarity and confidence. The programme is particularly valuable for analysts, consultants, and data scientists who must translate raw numbers into actionable strategies.
Career prospects for alumni are robust and diverse. Graduates frequently secure roles as Senior Data Analysts, Business Intelligence Consultants, or Quantitative Researchers within leading financial institutions, technology firms, and global consulting agencies. By mastering the art of
Programme Features
Industry-Aligned Curriculum
Developed with industry leaders for job-ready skills
Globally Recognised Certificate
Recognised by employers across 180+ countries
Flexible Online Learning
Study at your own pace with lifetime access
Instant Access
Start learning immediately, no application process
Constantly Updated Content
Latest industry trends and best practices
Career Advancement
87% report measurable career progression within 6 months
Course Modules
- Visual Encoding Principles: Examines how data attributes map to visual channels like position, length, and color.: Statistical Distributions: Analyzes probability density functions and cumulative distribution plots for data interpretation.
- Correlation and Regression: Explores scatter plots, trend lines, and goodness-of-fit metrics for predictive modeling.: Time Series Visualization: Covers line charts, seasonal decomposition, and anomaly detection in temporal datasets.
- Multivariate Techniques: Introduces methods for visualizing high-dimensional data such as parallel coordinates and heatmaps.: Critical Evaluation: Teaches strategies for identifying misleading graphs and selecting appropriate visualizations for specific analytical goals.
What's Included in This Programme
Here is what you get when you enrol with LSBR London
Programme Facts
Audience: Professionals seeking advanced data visualisation skills.
Prerequisites: Foundational knowledge of calculus and statistics.
Outcomes: Mastery of function graphs for analysis.
Ready to advance your career?
Join thousands of professionals who have transformed their careers with LSBR London. Enrol today and start learning immediately.
Why Study This Programme
Pursuing a Postgraduate Certificate in Mastering Function Graphs Function Graphs for Data Analysis offers distinct strategic advantages for professionals seeking to elevate their analytical proficiency. This qualification bridges the gap between theoretical mathematics and practical data interpretation, ensuring candidates remain competitive in an increasingly data-driven marketplace.
Enhanced Visual Communication Capabilities: Professionals learn to translate complex multivariate functions into intuitive graphical representations. This skill allows stakeholders to grasp intricate trends rapidly, fostering more informed decision-making processes within executive teams. The ability to present data visually reduces ambiguity and accelerates project approval cycles.
Advanced Predictive Modelling Skills: The curriculum emphasises the application of function graphs in forecasting scenarios. Graduates gain proficiency in identifying non-linear patterns that traditional linear models often overlook. This capability enables organisations to anticipate market shifts with greater precision, thereby mitigating risk and optimising resource allocation effectively.
Competitive Differentiation in the Job Market: Holding this specialised certificate signals a commitment to technical excellence. It distinguishes candidates from peers who possess only generic analytical training. Employers value this niche expertise, often resulting in accelerated career progression and access to senior analytical roles that require sophisticated data handling techniques.
Immediate Practical Application: The programme integrates real-world case studies, allowing learners to apply concepts directly to their current workflows. This immediate relevance ensures that theoretical knowledge translates into tangible business outcomes, enhancing overall operational efficiency and analytical rigour within the organisation.
"This programme gave me the confidence and credentials to secure a senior role. Highly recommend LSBR London."
— Sarah M., United Kingdom
Course Brochure
Download our comprehensive course brochure with all details
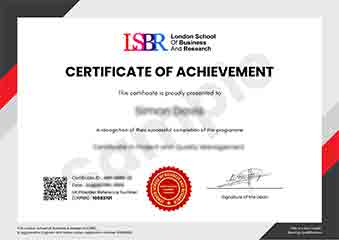
Sample Certificate
Preview the certificate you'll receive upon successful completion of this program.
Get Course Info
Receive the full course guide, pricing details, and enrolment instructions directly in your inbox.
Check your inbox!
Course details have been sent to your email.
Get Your Employer to Sponsor This Programme
Many employers offer professional development budgets. We make it easy for your company to invest in your growth with corporate invoicing and bulk enrolment options.
Email Template for Your Manager
Dear [Manager's Name],
I would like to request sponsorship for the Postgraduate Certificate in Mastering Function Graphs for Data Analysis programme offered by LSBR London - Executive Education.
The programme costs $149 (one-time) and can be completed in 3-4 weeks alongside my regular duties.
Key benefits to our team:
- Immediately applicable skills
- Globally recognised certificate
- Corporate invoice available
Best regards,
[Your Name]
What Our Students Say
Hear from our students about their experience with the Postgraduate Certificate in Mastering Function Graphs for Data Analysis at LSBR London - Executive Education.
James Thompson
United Kingdom"The course material provided a rigorous yet accessible deep dive into visualizing complex data relationships, transforming abstract mathematical concepts into intuitive graphical insights. I now possess the practical ability to quickly identify trends and anomalies in large datasets, a skill that has significantly enhanced my analytical efficiency in professional settings."
Sophie Brown
United Kingdom"Mastering the nuances of function graphs has transformed how I interpret complex datasets, allowing me to spot trends that standard analytics tools often miss. This specialized skill set immediately elevated my value in the data science team, leading to a promotion where I now lead predictive modeling initiatives."
Jia Li Lim
Singapore"The logical progression from foundational plotting techniques to complex data visualization strategies made the material incredibly accessible and easy to retain. This structured approach significantly enhanced my ability to interpret large datasets, providing immediate value for my current analytical projects."
Your Certification Journey
Four simple steps from enrolment to your globally recognised certificate
Enrol Online
Complete your enrolment in under 2 minutes with secure checkout
Start Learning
Get instant access to all course materials and start at your own pace
Complete Modules
Work through the curriculum with expert support available throughout
Get Certified
Receive your LSBR London certificate recognised across 180+ countries
LSBR London by the Numbers
Join a global community of professionals advancing their careers
Students Enrolled
Countries Represented
Average Rating
Career Progression