
Professional Certificate in Graphing for Data-Driven Insights
Master data visualization to transform complex datasets into clear, actionable insights that drive informed, strategic business decisions.
Professional Certificate in Graphing for Data-Driven Insights
Programme Summary
The Professional Certificate in Graphing for Data-Driven Insights equips analysts, marketing strategists, and business leaders with advanced visualisation techniques to transform complex datasets into compelling narratives. This rigorous curriculum addresses the critical gap between raw data extraction and strategic communication, ensuring professionals can articulate findings with precision. Participants engage with industry-standard tools to master the principles of visual hierarchy, colour theory, and chart selection, thereby enhancing their ability to convey statistical significance to non-technical stakeholders. The programme serves as a vital bridge for individuals seeking to elevate their analytical reporting from basic spreadsheets to executive-level dashboards that drive informed decision-making.
Learners acquire mastery in constructing accurate, misleading-free visual representations through hands-on workshops focused on cognitive load reduction and perceptual integrity. The syllabus covers advanced functionality within Tableau and Power BI, alongside foundational Python libraries such as Matplotlib and Seaborn for customised graphic generation. Students learn to identify and correct common visual distortions, ensuring that every axis, label, and data point contributes to a truthful interpretation of trends. This technical proficiency is complemented by strategic training in narrative design, enabling participants to structure visual stories that highlight key insights while eliminating irrelevant noise from the data landscape.
Completion of this certificate significantly enhances employability in roles demanding high-level data storytelling and strategic insight generation. Graduates position themselves as indispensable assets capable of translating quantitative complexity into actionable business intelligence for senior leadership. The credential signals a proven competency in visual analytics, distinguishing candidates in competitive job markets for
Learning Outcomes
In an era defined by exponential data growth, the ability to translate complex datasets into compelling visual narratives is no longer a peripheral skill; it is a central competency for strategic leadership. The Professional Certificate in Graphing for Data-Driven Insights equips professionals with the technical proficiency and aesthetic sensibility required to transform raw information into actionable intelligence. This rigorous programme moves beyond basic chart creation, focusing instead on the cognitive psychology of visual perception and the ethical dimensions of data representation.
Participants engage with advanced methodologies in statistical visualization, mastering tools such as Tableau, Python’s Matplotlib, and R’s ggplot2. The curriculum explores the nuances of colour theory, spatial arrangement, and narrative flow, ensuring that every visual element serves a distinct analytical purpose. Learners dissect case studies from leading multinational corporations, analysing how effective graphing has driven pivotal business decisions in sectors ranging from financial services to public health. Emphasis is placed on identifying and mitigating visual bias, thereby fostering integrity and transparency in corporate reporting.
Upon completion, graduates emerge as confident communicators capable of bridging the gap between technical data scientists and non-technical stakeholders. They apply these refined skills to streamline decision-making processes, enhance stakeholder engagement, and uncover hidden trends within vast datasets. The certificate opens doors to diverse career trajectories, including roles as Data Visualization Specialist, Business Intelligence Analyst, and Insights Manager. Employers increasingly seek candidates who can not only interpret data but also present it with clarity and impact. By mastering the art and science of
Programme Features
Industry-Aligned Curriculum
Developed with industry leaders for job-ready skills
Globally Recognised Certificate
Recognised by employers across 180+ countries
Flexible Online Learning
Study at your own pace with lifetime access
Instant Access
Start learning immediately, no application process
Constantly Updated Content
Latest industry trends and best practices
Career Advancement
87% report measurable career progression within 6 months
Course Modules
- Data Literacy and Visualization Principles: Introduces the fundamentals of data interpretation and visual encoding.: Statistical Foundations for Graphing: Covers essential statistical measures and distributions relevant to visual analysis.
- Chart Selection and Design Best Practices: Teaches how to choose the right chart types and apply design principles for clarity.: Creating Effective Static Visualizations: Focuses on building clear and accurate charts using standard visualization tools.
- Interactive Dashboards and Storytelling: Explores techniques for building interactive views and communicating insights through narrative.: Ethics, Accessibility, and Professional Presentation: Addresses bias, accessibility standards, and best practices for presenting data to stakeholders.
What's Included in This Programme
Here is what you get when you enrol with LSBR London
Programme Facts
Audience: Aspiring analysts and business professionals seeking data visualisation expertise.
Prerequisites: Basic statistical knowledge and proficiency in standard spreadsheet software.
Outcomes: Mastery of graphing techniques to drive strategic, evidence-based decision-making.
Ready to advance your career?
Join thousands of professionals who have transformed their careers with LSBR London. Enrol today and start learning immediately.
Why Study This Programme
The 'Professional Certificate in Graphing for Data-Driven Insights' offers a compelling avenue for career advancement in an increasingly data-centric global economy. Professionals seeking to distinguish themselves should consider this programme for the following strategic advantages.
Mastery of Visual Storytelling: Candidates acquire the ability to transform complex datasets into compelling visual narratives. This skill enables stakeholders to grasp intricate patterns instantly, thereby accelerating decision-making processes and enhancing strategic alignment across organisations.
Enhanced Analytical Rigour: The curriculum emphasises statistical accuracy alongside aesthetic clarity. Learners develop a critical eye for identifying misleading representations, ensuring that all communications maintain the highest standards of integrity and precision. This competence builds trust with senior leadership and clients alike.
Competitive Market Differentiation: Possessing certified expertise in advanced graphing techniques sets candidates apart in crowded job markets. Employers increasingly value professionals who can bridge the gap between raw data and actionable business intelligence, making this qualification a significant asset during recruitment and promotion cycles.
Immediate Operational Impact: Graduates can immediately apply their new skills to improve internal reporting mechanisms. This leads to more efficient resource allocation and clearer performance metrics, directly contributing to organisational success and demonstrating tangible value to employers.
This certificate equips individuals with the practical tools necessary to thrive in modern business environments. It fosters a deeper understanding of data interpretation while refining the professional’s ability to communicate insights effectively. Such capabilities are indispensable for leaders aiming to drive evidence-based strategies and maintain a competitive edge.
"This programme gave me the confidence and credentials to secure a senior role. Highly recommend LSBR London."
— Sarah M., United Kingdom
Course Brochure
Download our comprehensive course brochure with all details
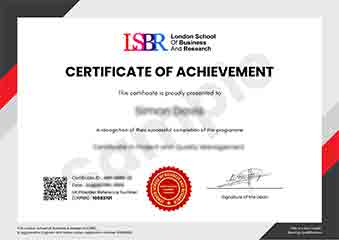
Sample Certificate
Preview the certificate you'll receive upon successful completion of this program.
Get Course Info
Receive the full course guide, pricing details, and enrolment instructions directly in your inbox.
Check your inbox!
Course details have been sent to your email.
Get Your Employer to Sponsor This Programme
Many employers offer professional development budgets. We make it easy for your company to invest in your growth with corporate invoicing and bulk enrolment options.
Email Template for Your Manager
Dear [Manager's Name],
I would like to request sponsorship for the Professional Certificate in Graphing for Data-Driven Insights programme offered by LSBR London - Executive Education.
The programme costs $149 (one-time) and can be completed in 3-4 weeks alongside my regular duties.
Key benefits to our team:
- Immediately applicable skills
- Globally recognised certificate
- Corporate invoice available
Best regards,
[Your Name]
What Our Students Say
Hear from our students about their experience with the Professional Certificate in Graphing for Data-Driven Insights at LSBR London - Executive Education.
Sophie Brown
United Kingdom"The curriculum provided a robust foundation in data visualization principles, moving beyond basic charting to teach how to effectively communicate complex insights. I now feel confident in selecting the right graphical representations to drive decision-making in my professional projects."
Klaus Mueller
Germany"Mastering advanced visualization techniques allowed me to transform complex datasets to tell compelling stories, directly influencing strategic decisions in my previous role. This practical expertise not only streamlined my reporting processes but also positioned me for a promotion by demonstrating clear, data-driven insights to stakeholders."
Madison Davis
United States"The logical progression of modules made complex visualization concepts accessible and easy to retain. I now feel confident applying these data storytelling techniques to drive strategic decisions in my daily work."
Your Certification Journey
Four simple steps from enrolment to your globally recognised certificate
Enrol Online
Complete your enrolment in under 2 minutes with secure checkout
Start Learning
Get instant access to all course materials and start at your own pace
Complete Modules
Work through the curriculum with expert support available throughout
Get Certified
Receive your LSBR London certificate recognised across 180+ countries
LSBR London by the Numbers
Join a global community of professionals advancing their careers
Students Enrolled
Countries Represented
Average Rating
Career Progression